Introducing the Hexawise Coverage Matrix!

Introducing the Hexawise Coverage Matrix!
What is the Coverage Matrix?
Some of the most challenging questions testing teams are asked include:
- Are we testing enough?
- Are we testing too much?
- What is the level of testing coverage these tests achieve?
- What if we get extremely pressed for time… What level of coverage could we achieve in half as many tests as we have planned?
Hexawise now allows you to visualize testing coverage more precisely than ever. The precise pairwise interactions covered by Hexawise-generated tests are displayed in the Coverage Matrix. This is different than our Coverage Graph, which allows users to see the additional coverage each test in their test set provides but does so without providing as much granular detail.
The Hexawise Coverage Matrix is a grid made up of all the pairs in the test plan being analyzed. With each value listed down the side and also across the top, you can find an intersection and see if that specific pair is covered at any point in your set of Hexawise-generated tests. Read on for the specific features of this reporting function.
The Coverage Matrix in action
Before we dive into the specifics of the Coverage Matrix, let’s see it in action.
If we have a test plan and have created some tests, we need to go the ‘Analyze Tests’ screen and click on Coverage Matrix. I recommend using a larger test plan (5+ parameters with a handful of values each) to truly see the power this visualization has.
![]()
‘OoooOOOooo’ snazzy new layout. That’s right, we’re taking it up a notch!
Once you click on the Coverage Matrix, the chart goes through an animation showing the coverage each tests achieves.
Things to look for in the animation
- Just beneath the slider over the chart, you can see what percentage of interactions is covered (just like the Coverage Graph)
- Also underneath the slider, you can see the precise test that is being displayed
- The Coverage Matrix starts fully red (0 tests equals 0% coverage)
- As each test is added, the coverage increases turning each pair covered into a green square
- The slider at the top can be used after the animation is complete

How to read the Coverage Matrix
Now let’s get into the specifics of this feature.
What the squares mean
The Coverage Matrix has 3 primary indicators for coverage:
- Red Squares: A pair not currently covered
- Green Squares: A pair that has been covered
- Black Squares: A pair that will never be covered
Red Squares: The Coverage Chart starts off all red, since at 0 tests, 0 pairs are covered. The number of red squares will decrease with each subsequent test as coverage increases with each test. At any given test, the amount of red squares is the equivalent to the amount of pairwise gaps.
Green Squares: As each test is added, more pairs are covered. The squares convert from red to green. If you were to stop executing Hexawise-generated tests before the final test, you would leave gaps in your pairwise coverage. The green squares show you what you will have covered if you stop early.
Black Squares: If you add invalid or married pairs to your test plan, you are intentionally removing pairs from ever appearing in your test set. Usually that will be because such combinations are impossible or impractical to test together (such as O/S = Mac OSX with Browser = Internet Explorer). The pairs that are removed are shown as black squares in the Coverage Matrix.
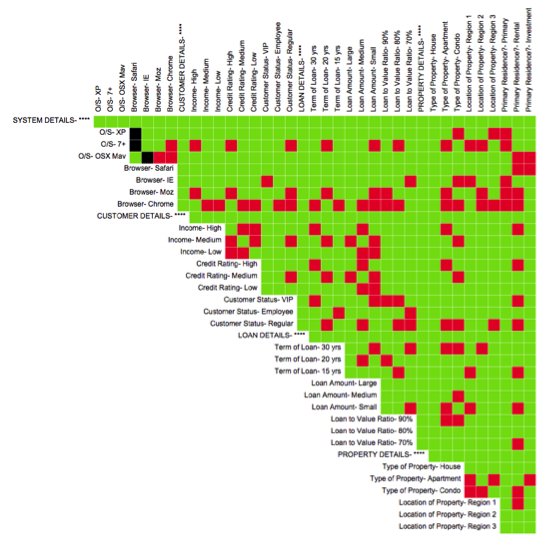
How the Coverage Matrix is laid out
Your parameter values are listed down the side and across the top. The intersection of the parameter values is the coverage status for a particular pair of values.
This is a Coverage Matrix
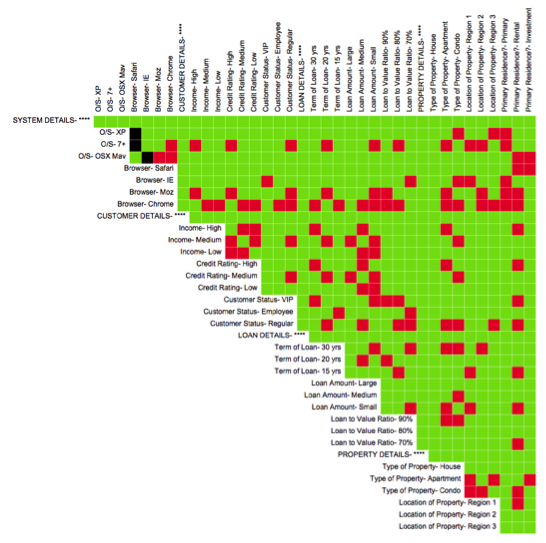
Your parameter values
In order to make for a nice display, the parameters are listed down the side from the first to the second to last, and then across the top from second parameter to the last parameter.
Example: If the parameters in the plan are ‘A,’ ‘B,’ ‘C,’ ‘D,’ and ‘E,’ you will have a Coverage Matrix that looks like this one:

Using the Coverage Matrix
Since each Hexawise-generated test includes many pairs (or sometimes just a few) the test designer is sometimes unaware of when each pair is covered. The Coverage Matrix allows the tester to visualize and communicate when a precise pair is first covered in their test set.
Let’s take a detailed look at exactly how the Coverage Matrix accomplishes this.
For this example, we have a Mortgage Application system being tested. We achieve 81% pairwise coverage after just 8 tests. What kind of pairs do we see being covered by our 8th test.

We also see there are sporadic red squares, since we are only viewing 80% coverage of all possible pairs. So we review this chart with our stakeholders, and they like it. But then they see towards the bottom that Region 2 is not tested with Investment Property. They tell you that situation needs to be covered, and ask how we’ll cover it.
By opening Hexawise, we can drag the slider to see when that red square turns green.
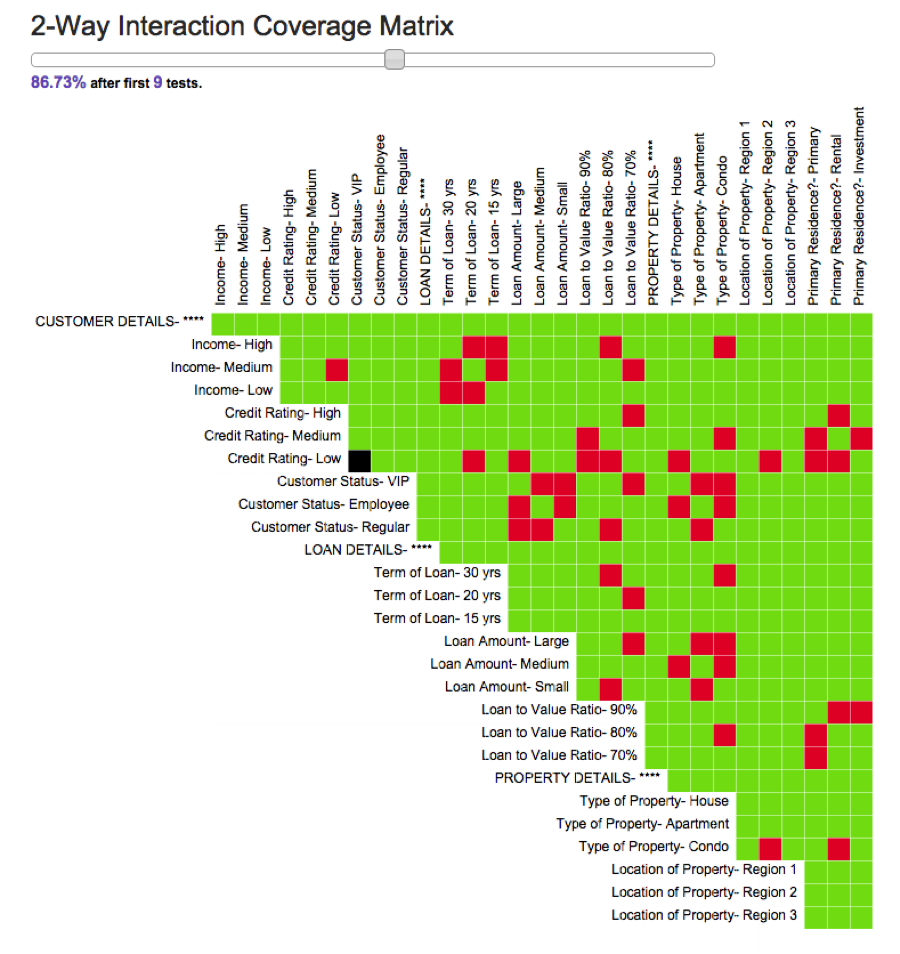
In this case, it’s the very next test: test 9. So we alert the stakeholders that we can cover that scenario by executing 9 tests, which bumps our overall coverage to 86% pairwise coverage.
In other similar situations, a given “high-priority” combination might not appear until significantly later in a plan. If a stakeholder-requested combination did not appear until near the end in this example, we might be best off executing the first 8 Hexawise tests and then addressing that stakeholder-requested combination in a one-off test outside of Hexawise. (There are “fancier” options for achieving that goal (such as using Hexawise’s “freeze” function), but that’s a different topic for a different blog post. This one is lengthy as it is.
Related Considerations
Anyone still reading at this point deserves a couple bits of extra insight:
First, it is important to keep in mind that Hexawise orders your tests in an optimal way so that if you stop testing after any given test, you will have covered as much as possible within the amount of time you have had to test. You can see this by comparing the (much larger) number of squares that turn green in your first test to the (much smaller) number of squares that turn green in your final test.
Second, if you are discussing the Coverage Matrix with a stakeholder who is new to Hexawise’s optimized coverage approach, they might need a brief explanation about why pairwise testing coverage is such an effective starting point for test prioritization. Introductory articles such as “Why do most software tests suck?” and “Does pairwise testing really work?” might be helpful. Additionally, it is equally important to remember that high priority scenarios that need to consist of more than 2 values should also be included in your test sets. If a stakeholder suggests including an involved scenario in your tests, keep in mind these two things. You can easily force such scenarios to be included in your test sets using Hexawise’s Requirements Feature. Those seeded high-priority scenarios will appear in the very first tests in your Hexawise test set; you do not need the new Matrix Chart to confirm that they are being included in your test set.
A Few Final Thoughts
This is one of our favorite Hexawise features we have ever released. We’re excited to make it available it and truly hope you find it to be useful. We are constantly seeking new ways to make it easier for software testers to not only create unusually powerful, thorough, efficient, and effective test sets but also new ways to help testers and stakeholders communicate clearly about the software testing coverage that their tests are achieving. We hope that the new Coverage Matrix feature will make it easier for you to communicate the superior testing coverage you’re achieving when you discuss your Hexawise-generated tests with stakeholders.